Modalities
Transmission Electron Microscopy
A transmission electron microscope (TEM) sends electrons through a very thin specimen to reveal its internal structure, sometimes down to individual atomic columns.
In semiconductor fabrication and failure analysis, TEM helps inspect layer interfaces, dislocations, stacking faults and grain boundaries. It also reveals the nanoscale structure of battery materials and catalysts.
AI Agent Potential
AI agents are already capable of substantial quantitative TEM analysis. In my evaluations, stronger agents wrote and revised analysis code, measured local lattice spacings and orientations, indexed diffraction patterns and calibrated instrument responses. Some also made sound physical judgements, recognising, for example, that multiple scattering can produce reflections absent from a simple diffraction model. Their practical strength is connecting this knowledge to computation: a proposed analysis becomes an executable workflow that can be repeated across many images or spectra, with the calculations available for inspection. This offers a route to broader coverage than manual inspection alone, allowing researchers to compare more particles, orientations and candidate structures without writing every analysis from scratch.
The gap to dependable autonomy lies in deciding whether a numerical result answers the physical question. Agents can obtain convincing fits while using unverified coordinates, fitting through a weak spectral feature or treating neighbouring pixels as independent measurements. They need to test these assumptions, distinguish acquisition artefacts from specimen structure, and let uncertainty constrain the final claim. The strongest analyses already show parts of this discipline, including retaining alternative structures and declining chemical assignments the data cannot support. Making that behaviour reliable could turn agents into experimental partners that screen large datasets, flag ambiguous regions and propose measurements that distinguish competing explanations. For TEM, the promise is to connect high-throughput analysis to better use of microscope time, leaving researchers more capacity to investigate unusual structures and make the consequential scientific decisions.
In a separate bimetallic nanoparticle task, 20 API runs through the Terminus 2 harness worked from 74 native microscopy and spectroscopy files. Astra and Opus measured local lattice spacings, compared copper and rhodium phase hypotheses, and tested how spectral background choices changed chemical conclusions. However, strong individual analyses did not guarantee a complete submission: two Astra runs passed eight of nine diagnostic groups, with one missing particle foreground and the other missing evidence that different images showed the same material. Opus sometimes recognised acquisition defects without consistently excluding affected pixels from later analyses. GLM and Gemini also produced substantial calculations, but errors in coordinates, array structure and chemical interpretation survived their own validation. One GLM run even closed its terminal after a search for “nan” matched “dominant”. None passed every group. These observations show why I test agent capability alongside scientific knowledge: dependable assistance requires tracking every acquisition, carrying validity checks through the whole workflow, and verifying the actual submission before declaring completion.
Example Task Demo
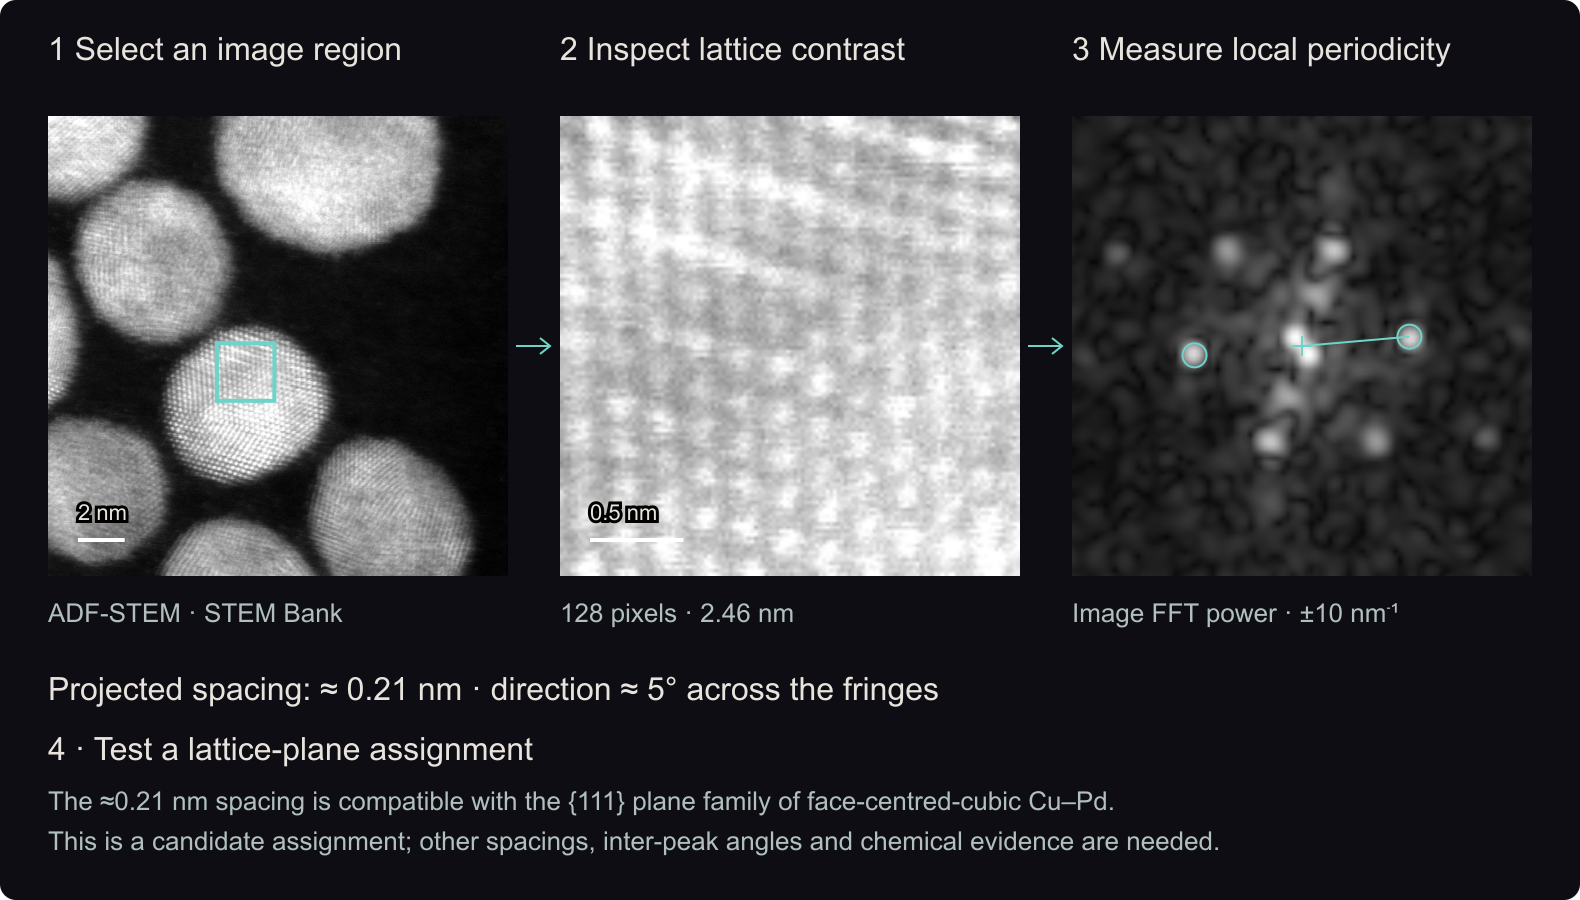
The first diagram uses a nanoparticle image acquired in annular dark-field scanning TEM (ADF-STEM). Select a region and inspect its Fourier transform, which reveals repeating image contrast and its projected lattice spacings, or d-spacings.
Matching spacings and angles to a proposed crystal structure is a quick consistency check. A single spacing cannot establish a metallic phase or exclude an oxide; chemical evidence is also needed. Comparing orientations across the particle helps distinguish a single crystal from multiple grains.
Public Task and Failure Modes
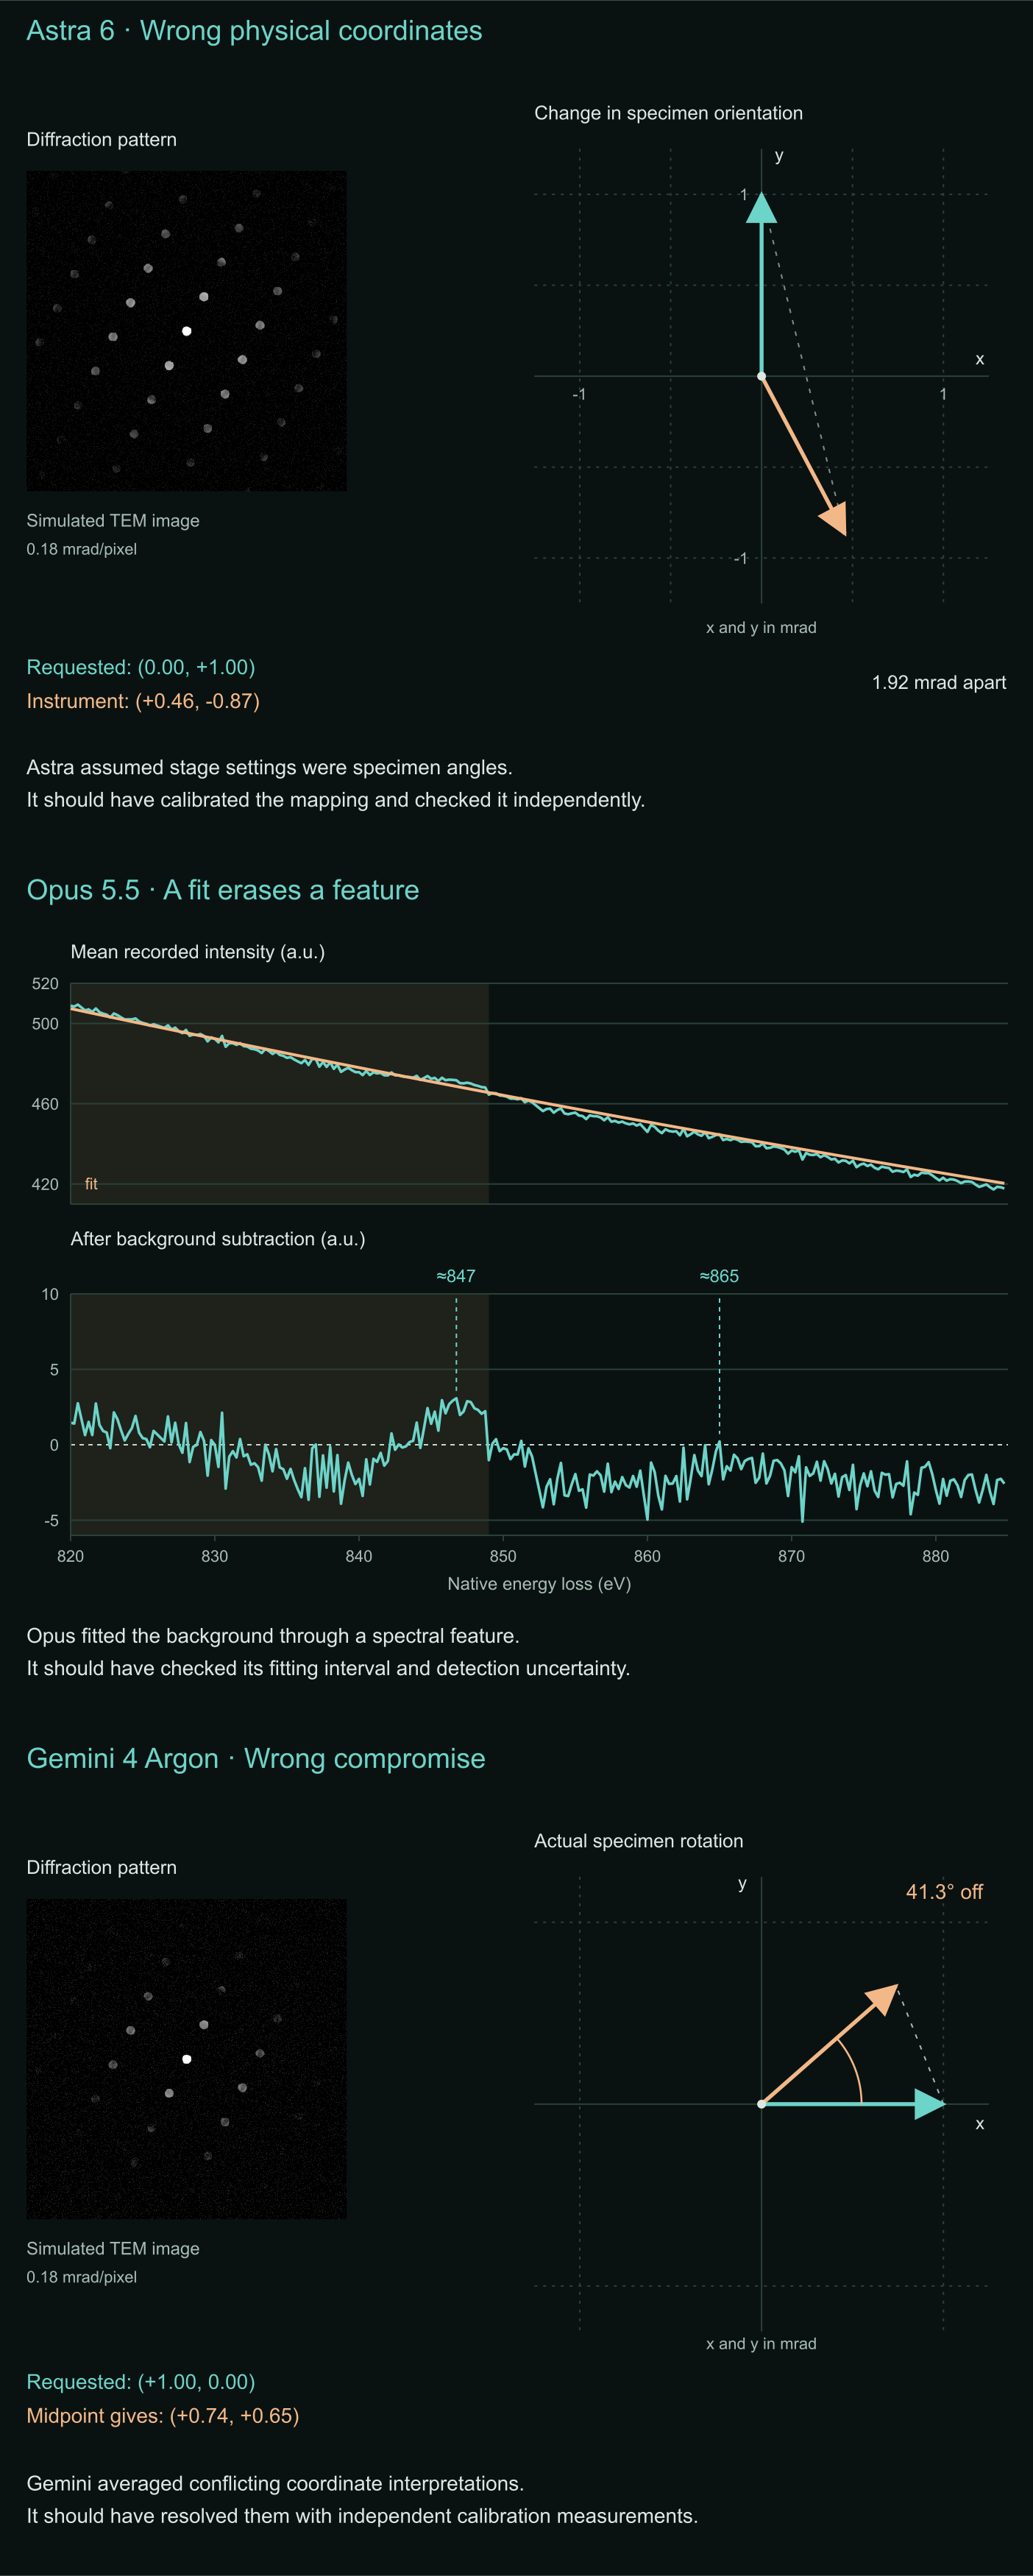
ValenceForge’s public TEM Control Task for the GDPx benchmark goes beyond this image-analysis step. AI models operate a simulated microscope, interpret images and spectra, and decide whether the evidence supports their conclusions. The second diagram explores three recorded failures: an uncalibrated tilt conversion, a background fit that suppresses a feature, and an untested compromise between coordinate mappings.
Click the image to move the window.
128 pixels across · 2.46 nm
Image FFT power · ±10 nm⁻¹
The circled Fourier peaks indicate the projected fringe spacing and the direction perpendicular to the fringes.
For the particle examples (≈0.21–0.22 nm), the {111} plane family of face-centred-cubic copper–palladium is one candidate interpretation. Other spacings, inter-peak angles and chemical evidence are needed to establish the phase.
Image source and method
The calculation subtracts the crop mean, applies a Hann window and computes a Fourier transform. The marked peak is the strongest candidate between 2 and 10 nm⁻¹; d = 1/q. It is an image spectrum, not a separately acquired diffraction pattern.
Image data: George Hollyer and Eric Stach. STEM-Bank-26: An Open Dataset of Analytical Scanning Transmission Electron Microscopy Images and Spectra. 26 October 2026.
Diffraction intensity changes with crystal orientation. Astra treated the microscope’s tilt controls as the requested specimen rotations, then validated its predictions using the same unverified conversion.
Requested rotationInstrument response to Astra’s command
Electron energy-loss spectroscopy (EELS) probes composition through the energy lost by transmitted electrons. Opus fitted its background through a spectral feature, then called the support nickel-free or below detection.
Recorded spectrumFitted backgroundFitting interval
Gemini tried to calibrate how specimen tilt changes the diffraction pattern. Unable to reconcile two coordinate interpretations, it chose their −13.5° midpoint and used that choice in its final response predictions.
Candidate coordinate mappings for the same intended tilt.